Sometimes, you may wonder or need to know if there is any simple way of visualizing your application’s performance and gaining insights into that performance data to identify issues and opportunities for optimization.
Well of course there is. Jaeger Tracing provides a framework that collects information about API/web requests for applications, as well as tools we can use to view, manipulate, and gain insights.
In this article we will try to understand how to do a tracing using an open source Jaeger with an example.
1. What is Tracing?
In a previous article, we dished on the benefits of tracing and why it is important that you use it. To put it shortly, tracing is used to understand the flow of the program and its data progressions on each step it has gone through.
By tracing through a stack, developers can identify bottlenecks and focus on improving performance. When a problem does occur, tracing allows you to see how you got there:
- Which function?
- The function’s duration;
- Parameters passed;
- How deep into the function the user could get;
- The Kinds of data per trace request would look like:
- Trace id;
- Span id;
- Parent span id;
- Application info (product, component);
- Module name;
- Context data (session/request-id, user id, etc.);
- Operation name and code;
- Start time;
- End time.
1. What is Jaeger?
Jaeger is a Distributed Tracing System, written in GO. The frontend is React/Javascript. It has pluggable storage like Cassandra, Elasticsearch, Memory, Badger, etc.
Jaeger, inspired by Dapper and OpenZipkin, is a distributed tracing platform created by Uber Technologies and donated to Cloud Native Computing Foundation. It can be used for monitoring microservices-based distributed systems:
- Distributed context propagation;
- Distributed transaction monitoring;
- Root cause analysis;
- Service dependency analysis;
- Performance/latency optimization;
Why do we need Jaeger?
Many times, it's an easy task to fix the issue. The hard part is identifying the issue in the first place and Jaeger is a reliable solution to this.
Our traditional logging systems contain concurrent requests, multiple hosts, and it’s impossible to correlate between them. Jaeger not only provides metrics that show something is wrong but also explains the reason.
So the question here is, do you want to debug an issue with tons of logs (which makes correlation almost impossible) OR do you want the metrics to understand the problematic area and isolate the troubleshooting only to that particular area?
Alternatives for Jaeger:
- Zipkin;
- AppDynamics;
- Prometheus;
- OpenTracing;
- Datadog;
Jaeger Architecture
To get a basic understanding of Jaeger architecture and its components, please take a look here:
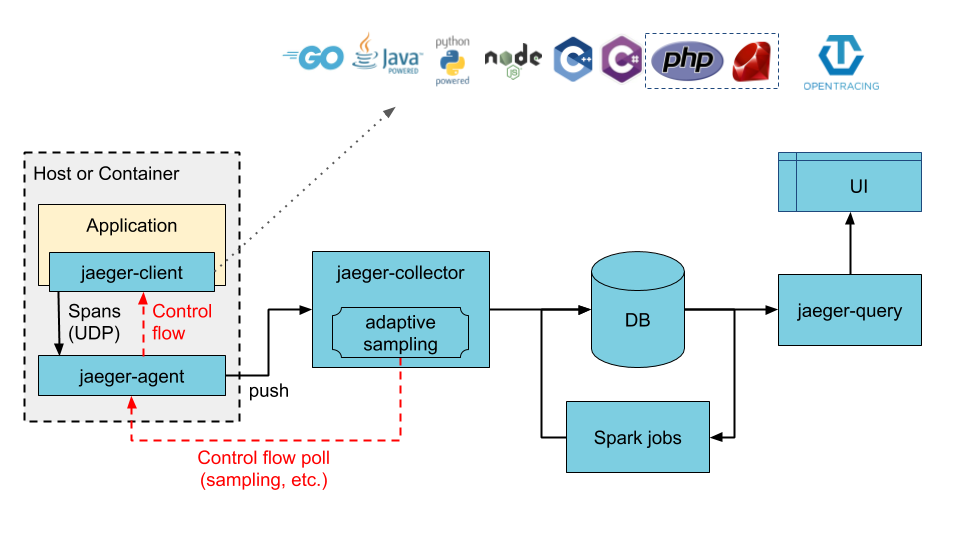
Agent: a network daemon that listens for spans sent over User Datagram Protocol.
Client: the component that implements the OpenTracing API for distributed tracing.
Collector: The component that receives spans and adds them into a queue to be processed.
Console: A UI that enables users to visualize their distributed tracing data.
Query: A service that fetches traces from storage.
Span: The logical unit of work in Jaeger, which includes the name, starting time, and duration of the operation.
Trace: The way Jaeger presents execution requests. A trace is composed of at least one span.
2. Installing Jaeger along with a sample application - HotRod
The next step is looking at what is HotRod and its prerequisites:
- HotRod is a ride-sharing application designed for Jaeger to demonstrate tracing.
- The HotRod application is implemented in Go and requires a Go Installation on your computer.
- The recommended way to run the Jaeger backend is with a Docker image, thus a Docker installation is required.
The installations are all Docker-based and the complete source code of the demo is available on GitHub. We will be cloning this repo in our demo installation section.
Step 1: Installing Jaeger
All the Jaeger components mentioned above are grouped and packaged inside a docker container called 'All in one'. So to install Jaeger we just need to install the jaeger docker image as shown below:
$ docker run -d -- name jaeger \
-e COLLECTOR_ZIPKIN_HTTP_PORT=9411 \
-p 5775:5775/udp \
-p 6831:6831/udp \
-p 6832:6832/udp \
-p 5778:5778 \
-p 16686:16686 \
-p 14268:14268 \
-p 14250:14250 \
-p 9411:9411 \
jaegertracing/all-in-one:1.21
The above command will provision the Jaeger container which includes all the Jaeger components in it, we can see the container running like below:
$ docker ps
CONTAINER ID IMAGE  COMMAND   CREATED  STATUS PORTS NAMES                   0529880c71e0        jaegertracing/all-in-one:1.21   "/go/bin/all-in-one-..."   3 days ago          Up 3 days           0.0.0.0:5775->5775/udp, 0.0.0.0:5778->5778/tcp, 0.0.0.0:9411->9411/tcp, 0.0.0.0:14250->14250/tcp, 0.0.0.0:14268->14268/tcp, 0.0.0.0:6831-6832->6831-6832/udp, 0.0.0.0:16686->16686/tcp   jaeger
You can then navigate to http://localhost:16686 to access the Jaeger UI.
Step 2: Installing the HotRod application
This is where we clone the Jaeger repository:
$ git clone [email protected]:jaegertracing/jaeger.git jaeger
Cloning into 'jaeger'...
remote: Enumerating objects: 56, done.
remote: Counting objects: 100% (56/56), done.
remote: Compressing objects: 100% (47/47), done.
remote: Total 15648 (delta 19), reused 24 (delta 8), pack-reused 15592
Receiving objects: 100% (15648/15648), 19.93 MiB | 1.89 MiB/s, done.
Resolving deltas: 100% (10296/10296), done.
Once this is done, we install the HotRod application:
$ cd jaeger

$ go run ./examples/hotrod/main.
go allgo: downloading
go.uber.org/zap v1.16.0
go: downloading github.com/uber/jaeger-lib v2.4.0+incompatible
go: downloading github.com/opentracing/opentracing-go v1.1.0
go: downloading github.com/spf13/cobra v0.0.5
go: downloading google.golang.org/grpc v1.29.1
go: downloading github.com/uber/jaeger-client-go v2.23.1+incompatible
go: downloading github.com/opentracing-contrib/go-stdlib v0.0.0-20190519235532-cf7a6c988dc9
go: downloading go.uber.org/multierr v1.5.0
go: downloading github.com/opentracing-contrib/go-grpc v0.0.0-20191001143057-db30781987df
go: downloading github.com/prometheus/client_golang v1.5.1
go: downloading github.com/spf13/pflag v1.0.5
go: downloading github.com/gogo/protobuf v1.2.1
go: downloading go.uber.org/atomic v1.6.0
go: downloading golang.org/x/net v0.0.0-20200625001655-4c5254603344
go: downloading google.golang.org/genproto v0.0.0-20190927181202-20e1ac93f88c
go: downloading github.com/golang/protobuf v1.3.4
go: downloading github.com/prometheus/client_model v0.2.0
go: downloading github.com/prometheus/procfs v0.1.3
go: downloading github.com/go-kit/kit v0.10.0go: downloading github.com/pkg/errors v0.9.1
go: downloading github.com/beorn7/perks v1.0.1
go: downloading github.com/cespare/xxhash v1.1.0
go: downloading github.com/prometheus/common v0.10.0
go: downloading github.com/cespare/xxhash/v2 v2.1.1
go: downloading golang.org/x/sys v0.0.0-20200625212154-ddb9806d33ae
go: downloading golang.org/x/text v0.3.4
go: downloading github.com/matttproud/golang_protobuf_extensions v1.0.1
go: downloading github.com/VividCortex/gohistogram v1.0.0
2021-02-02T01:00:44.428+0530    INFO    [email protected]/command.go:856    Using expvar as metrics backend
2021-02-02T01:00:44.428+0530    INFO    [email protected]/command.go:826    Starting all services
2021-02-02T01:00:44.537+0530    INFO    tracing/init.go:66    debug logging disabled    {"service": "route"}
2021-02-02T01:00:44.537+0530    INFO    tracing/init.go:66    debug logging disabled    {"service": "frontend"}
2021-02-02T01:00:44.537+0530    INFO    tracing/init.go:66    debug logging disabled    {"service": "driver"}
2021-02-02T01:00:44.537+0530    INFO    tracing/init.go:66    debug logging disabled    {"service": "customer"}
2021-02-02T01:00:44.537+0530    INFO    tracing/init.go:66    debug logging disabled    {"service": "route"}
2021-02-02T01:00:44.537+0530    INFO    tracing/init.go:66    debug logging disabled    {"service": "driver"}
2021-02-02T01:00:44.537+0530    INFO    tracing/init.go:66    debug logging disabled    {"service": "customer"}
2021-02-02T01:00:44.537+0530    INFO    tracing/init.go:66    debug logging disabled    {"service": "frontend"}
2021-02-02T01:00:44.538+0530    INFO    route/server.go:57    Starting    {"service": "route", "address": "http://0.0.0.0:8083"}
2021-02-02T01:00:44.538+0530    INFO    frontend/server.go:70    Starting    {"service": "frontend", "address": "http://0.0.0.0:8080"}
2021-02-02T01:00:44.644+0530    INFO    tracing/init.go:66    debug logging disabled    {"service": "customer"}
2021-02-02T01:00:44.644+0530    INFO    tracing/init.go:66    debug logging disabled    {"service": "driver"}
2021-02-02T01:00:44.644+0530    INFO    tracing/init.go:66    debug logging disabled    {"service": "driver"}
2021-02-02T01:00:44.644+0530    INFO    tracing/init.go:66    debug logging disabled    {"service": "customer"}
2021-02-02T01:00:44.644+0530    INFO    customer/server.go:55    Starting    {"service": "customer", "address": "http://0.0.0.0:8081"}
If you see this output, it means HotRod is up and running and you can navigate to the main service at http://127.0.0.1:8080:

Now we can say the Jaeger and HotRod installation is completed.
You see four customers; by clicking one of the four buttons we summon a car to arrive at the customer’s location, perhaps to pick up a product and deliver it elsewhere. Once a request for a car is sent to the backend, it responds with the car’s license plate number and the expected time of arrival.

There are a few bits of debugging information we see on the screen:
In the top left corner, there is a web client id: 4098. It is a random session ID assigned by Javascript UI; if we reload the page we get a different session ID.
- In the line about the car, we see a request ID req: 4098–1. It is a unique ID assigned by Javascript UI to each request it makes to the backend, composed of the session ID and a sequence number.
- The last bit of debugging data, latency: 739ms, is measured by the Javascript UI and shows how long the backend took to respond.
This additional information has no impact on the behavior of the application but will be useful when we look under the hood.
Microservices of the application:
The HotRod consists of four microservices and two databases:
Microservices:
- Frontend
- Customer
- Driver
- Route
Databases:
- Mysql
- Redis
The Frontend is the root service that servers the UI and RPC calls to the other three microservices. The data flow diagram is shown below:

That being said, let’s try to understand the data flow and visualize the data on Jaeger by example.
3. Visualizing data in Jaeger
Step 1: Access the Sample App
- Open the HotRod UI by hitting http://127.0.0.1:8080/ and click any one of the customer’s buttons.

Step 2: Find Traces
- Open the Jaeger UI by hitting http://127.0.0.1:16686/search.
- Under the “search” tab, select the 'frontend' service and hit the 'Find Traces' button:

Step 3: View the traced data
- Once you hit the button, Jaeger will list the traces made on the backend.
- The traces will show how many calls have been made from each microservice, as well as the calls which failed. Please see the below screenshot to understand it better.

Step 4: Dig deep into the traces
- If you want to go a step deeper, click the trace and it will show all the detailed information like below.
- You can find the traces in Jaeger UI to understand how much time it took on the backend.

When you click on the above trace, it will expand to list the services, the calls made by each service, and also various other details.

Here, on the left-hand side it displays the services like frontend, Redis, route (if we scroll down we can see other services too) and on the right-hand side, it will display the time taken for each call made by the services.
- So Redis service made 13 calls and all those 13 calls are in the ladder approach which is not good.
- The ladder approach means, the calls are made one by one, it's not simultaneously done.
- As a result, we can expect some latency/delay, so it helps to think about the mitigation steps required.
Also, we can get even more details/logs of each call by clicking the call itself.
Each call includes details such as span tags, process tags, and logs. Let’s click on one of the failed calls to Redis:

Note:
We can also select the traces and compare them to understand the average metrics which will be more useful.
Conclusion
We had discussed tracing, Jaeger and its components. Also installed Jaeger and used HotRod UI application to understand the traces. The all-in-one docker container is particularly effective at getting started with Jaeger.
And now for the important points you need to consider when doing tracing:
- What is the overall health and performance of your application?
- Are there errors in your distributed system/application (and if so, where)?
- The service dependencies across your distributed system?
- Is there unusual latency between or within my services (and if so, what’s causing it)?
- What services are upstream and downstream of the service that you are responsible for?
We believe that the advantages and flexibilities you will get from having a good tracing infrastructure will surely outweigh the initial cost of implementing.